
Spotfire® データ解析ツール
About Spotfire®
About Spotfire®
Charts created within the platform can be saved as templates and distributed via the web, making it suitable for standardized reporting.
In addition, Spotfire® provides multi-dimensional visualization and analytics across diverse data sources, allowing users to intuitively identify hidden issues and instantly bring new ideas to life.
Features
製品特長
Features
製品特長
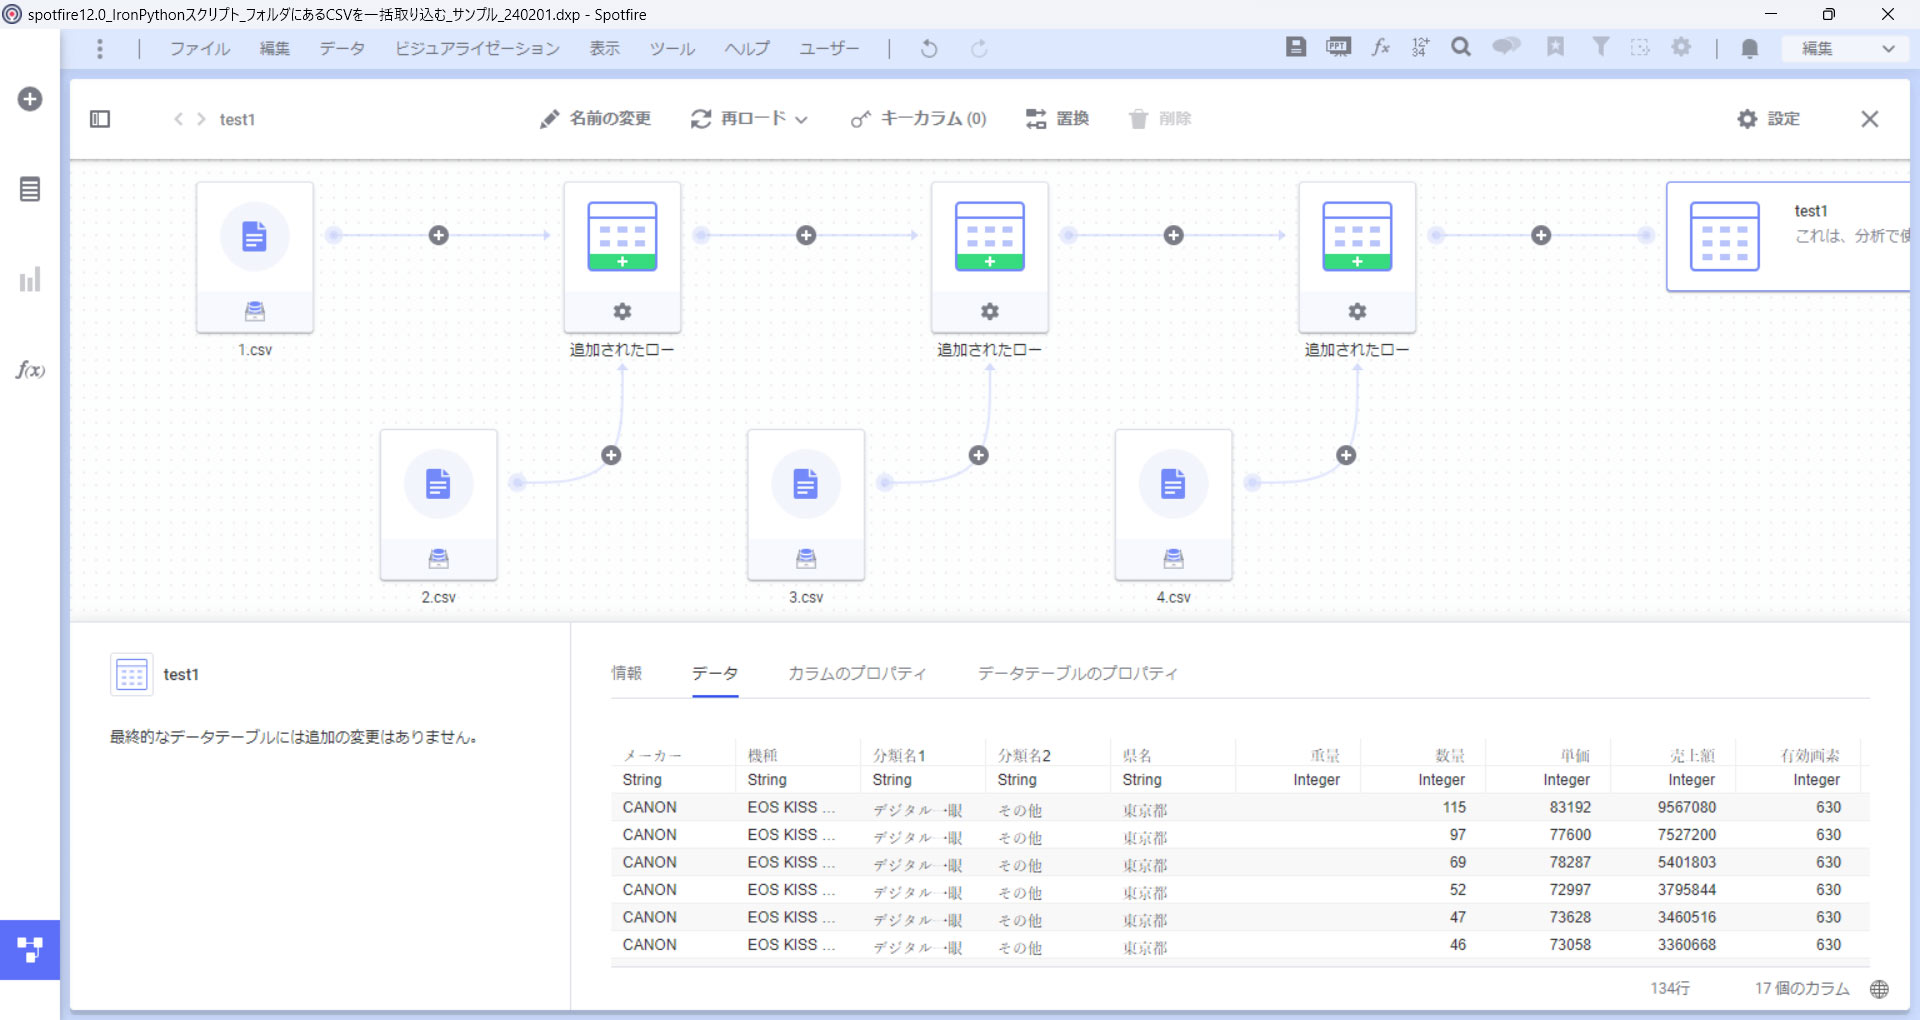
Data Pre-processing
Data Pre-processing
With Spotfire’s Data Canvas feature, complex pre-processing tasks such as data joins, pivot operations, and missing-value handling can be easily performed through a graphical user interface.
Furthermore, users can visually track the data-processing history and effortlessly add, modify, or delete processing steps. This significantly improves the efficiency of pre-processing workflows.
Equipped with Standard Statistical Analytics Functions
Equipped with Standard Statistical Analytics Functions
Features such as correlation analytics, clustering, and modeling can be utilized through simple operations on the graphical user interface.
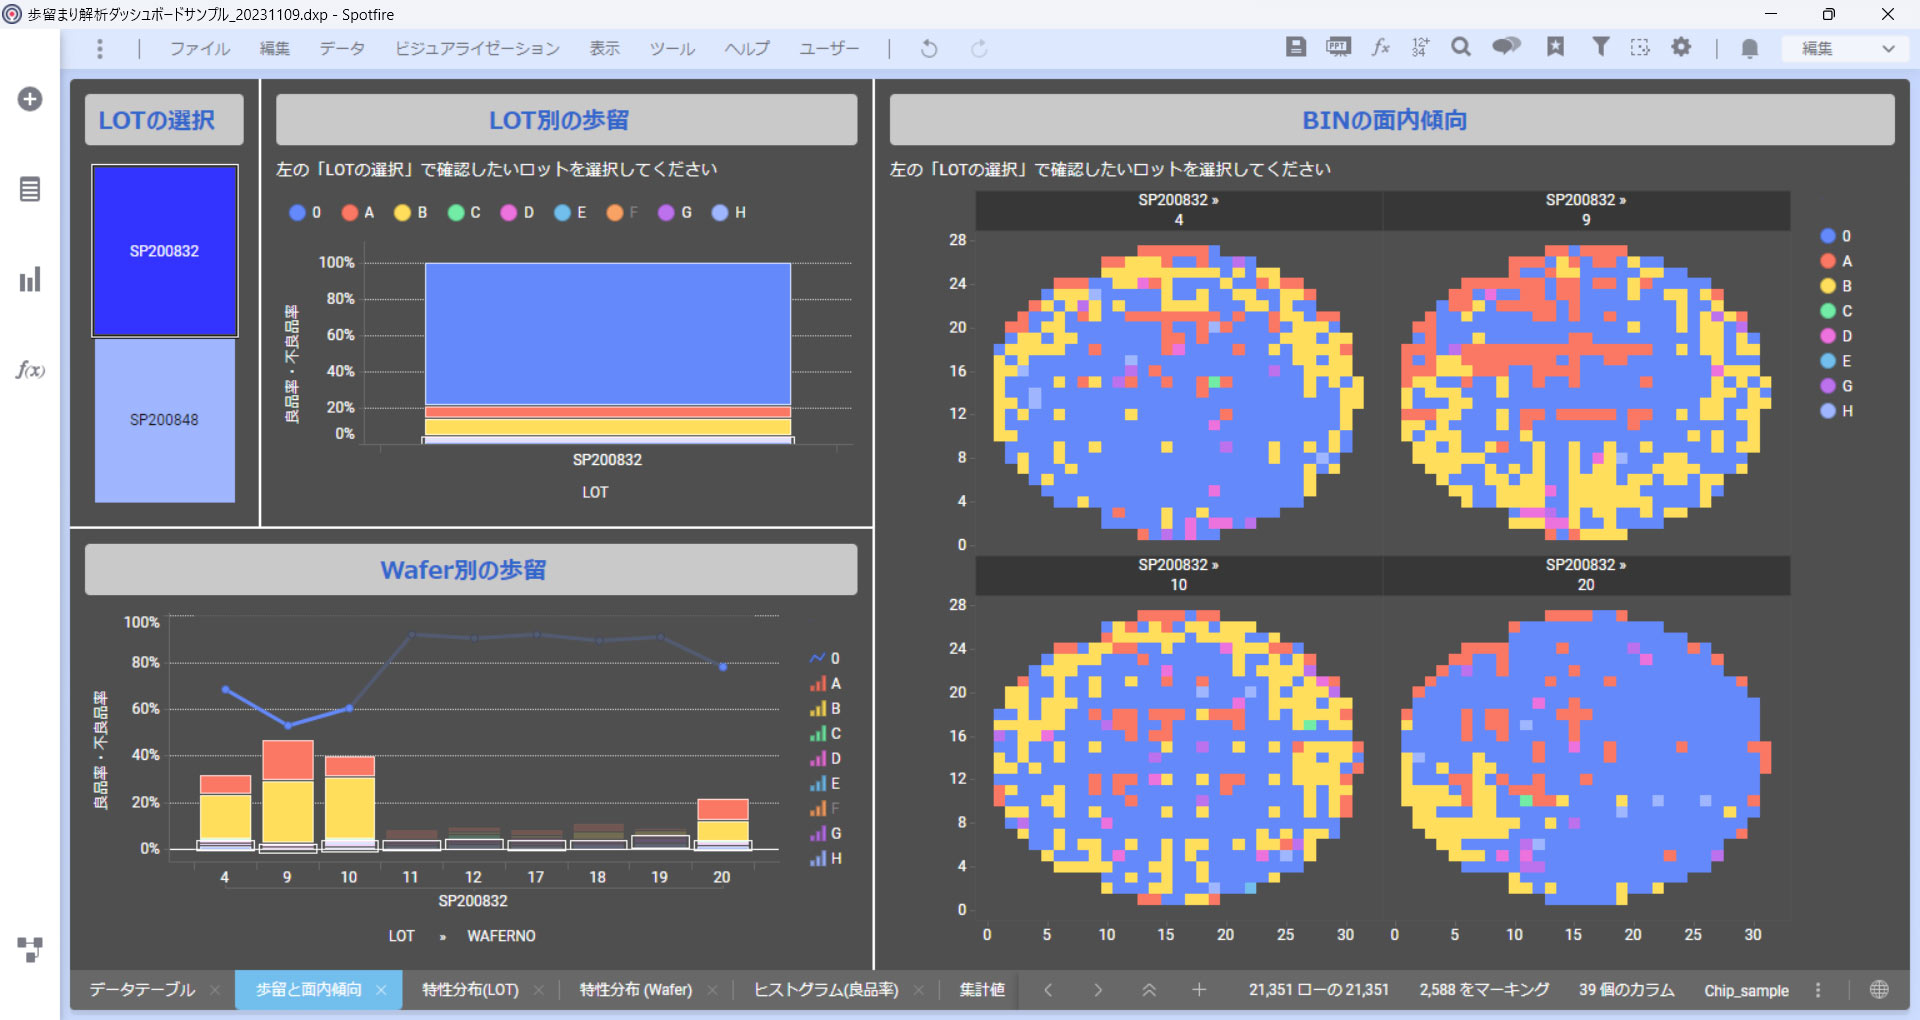
■ Correlation Analysis
Displays correlation rankings based on combinations of parameters.
■ Clustering Function
Classifies data into categories based on similarity.
This enables defect analysis using multiple parameter combinations as well as categorization of products with differing sales cycles.
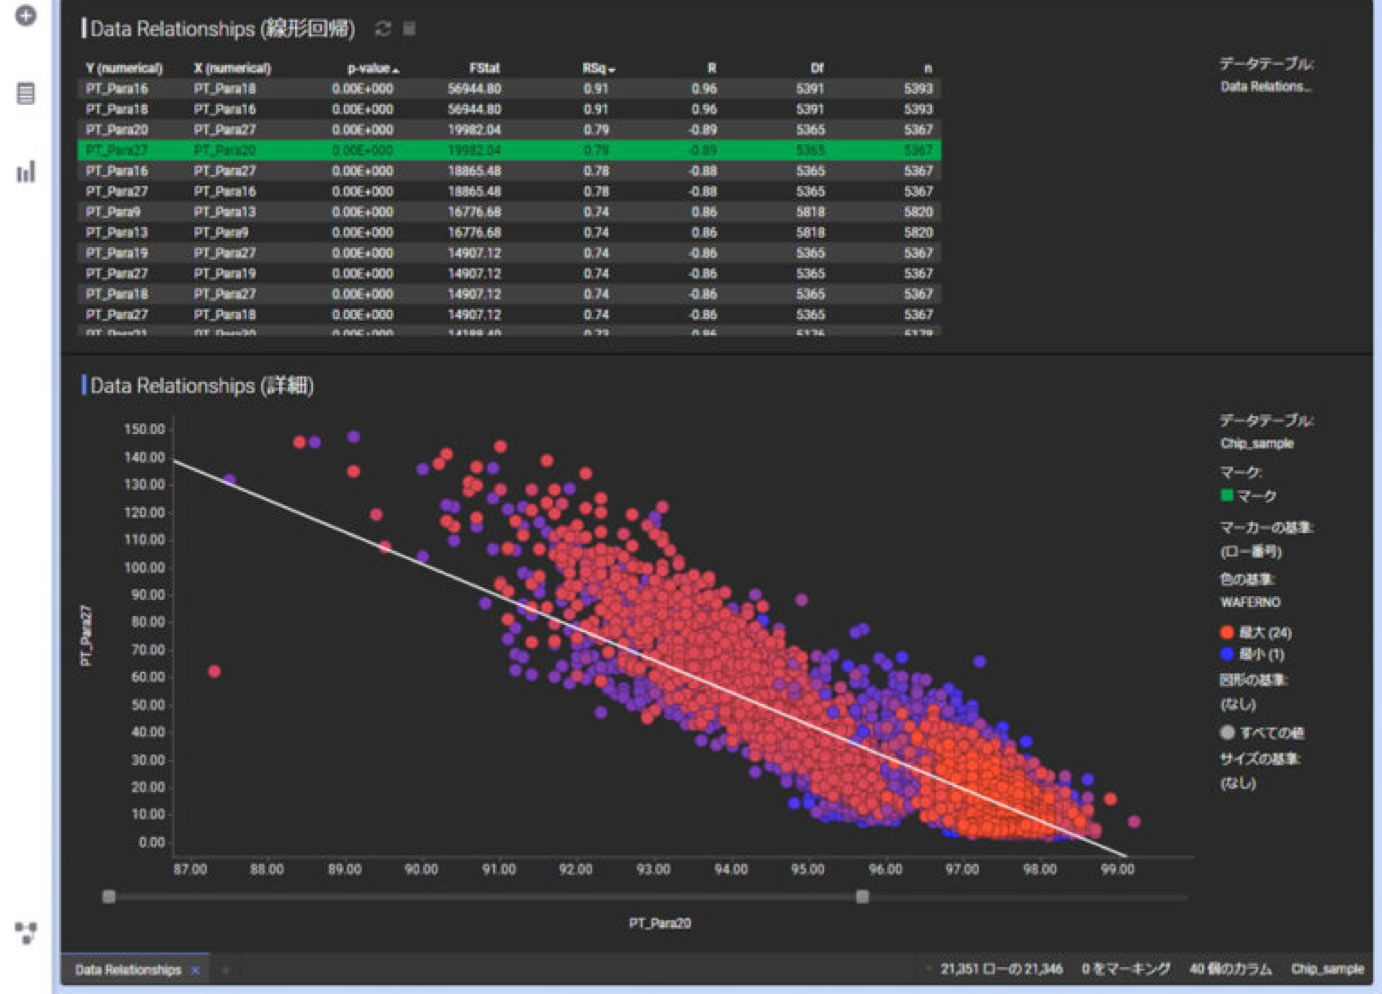
■ Modeling Function
Performs modeling using methods such as multiple regression and decision trees based on multiple parameters.
Prediction-model-based columns can be generated through mouse operations alone.
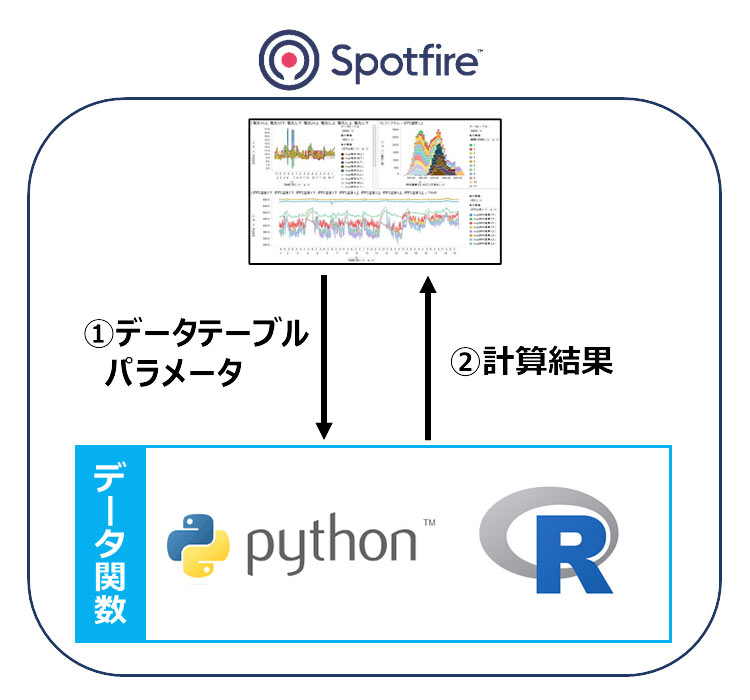
Integration of Statistical Analytics and Visualization through Python and R
Integration of Statistical Analytics and Visualization through Python and R
While scripting is required, users can execute Python and R scripts as data functions directly from Spotfire and visualize the results within the platform.
In addition, by executing no-code analytical workflows created in “Spotfire® Data Science”, a software solution specialized for data science, Spotfire enables more advanced analytics.
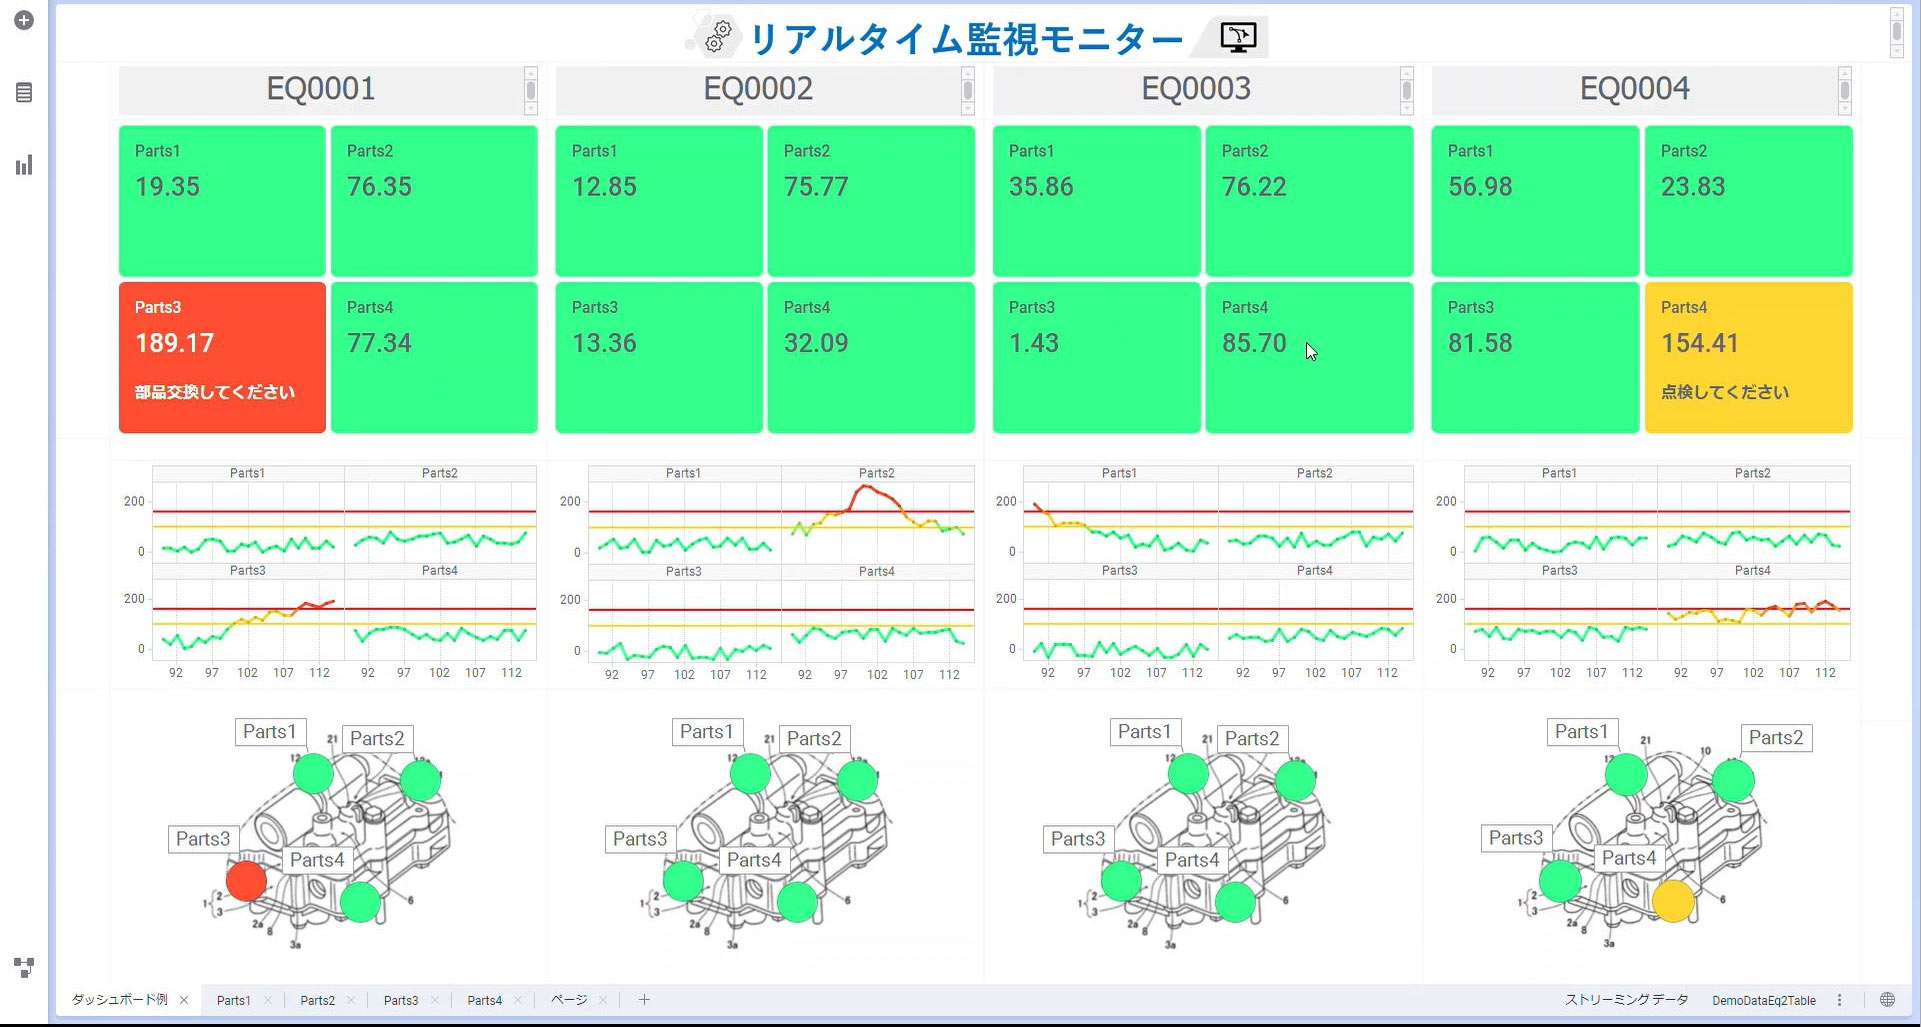
Real-Time Analytics
Real-Time Analytics
Additionally, based on predefined analytical scenarios, Spotfire® can detect events in real time and execute effective actions such as sending alert emails when thresholds are exceeded.
USE CASE
導入事例
USE CASE
導入事例


SYSTEM REQUIREMENTS
システム要件
SYSTEM REQUIREMENTS
システム要件
- OS
- Windows 11
Windows 10 - Processor
- Minimum: 2 cores, 2 GHz, 64-bit
Recommended: 4 cores or more, 2 GHz or higher, 64-bit - RAM
- Minimum: 4 GB
Recommended: 8 GB or more - HDD
- 10 GB or more of available disk space
- Display
- Minimum: 1024 × 768 pixels
Recommended: 1920 × 1080 pixels or higher
Sales & Supports
Software Licensing, Implementation, and Support
Sales & Supports
Software Licensing, Implementation, and Support
A complimentary evaluation license is available, allowing you to explore the platform before making a commitment.
For further information or inquiries, please feel free to contact us.
- ■ Licens fee
- One-year subscription
- ■ Implementation and Support
- Assistance with initial setup and environment configuration
- Conduct user training sessions (from beginner to advanced levels).
- Support for Template Creation
- Data Analytics Assistance